8.6 Daily Flights Example
Let’s work through a dataset including the number of flights that leave NYC per day. This is a really small dataset — only 365 rows and 2 columns — and we’re not going to end up with a fully realised model, but as you’ll see, the steps along the way will help us better understand the data. Let’s get started by counting the number of flights per day and visualising it with ggplot2.
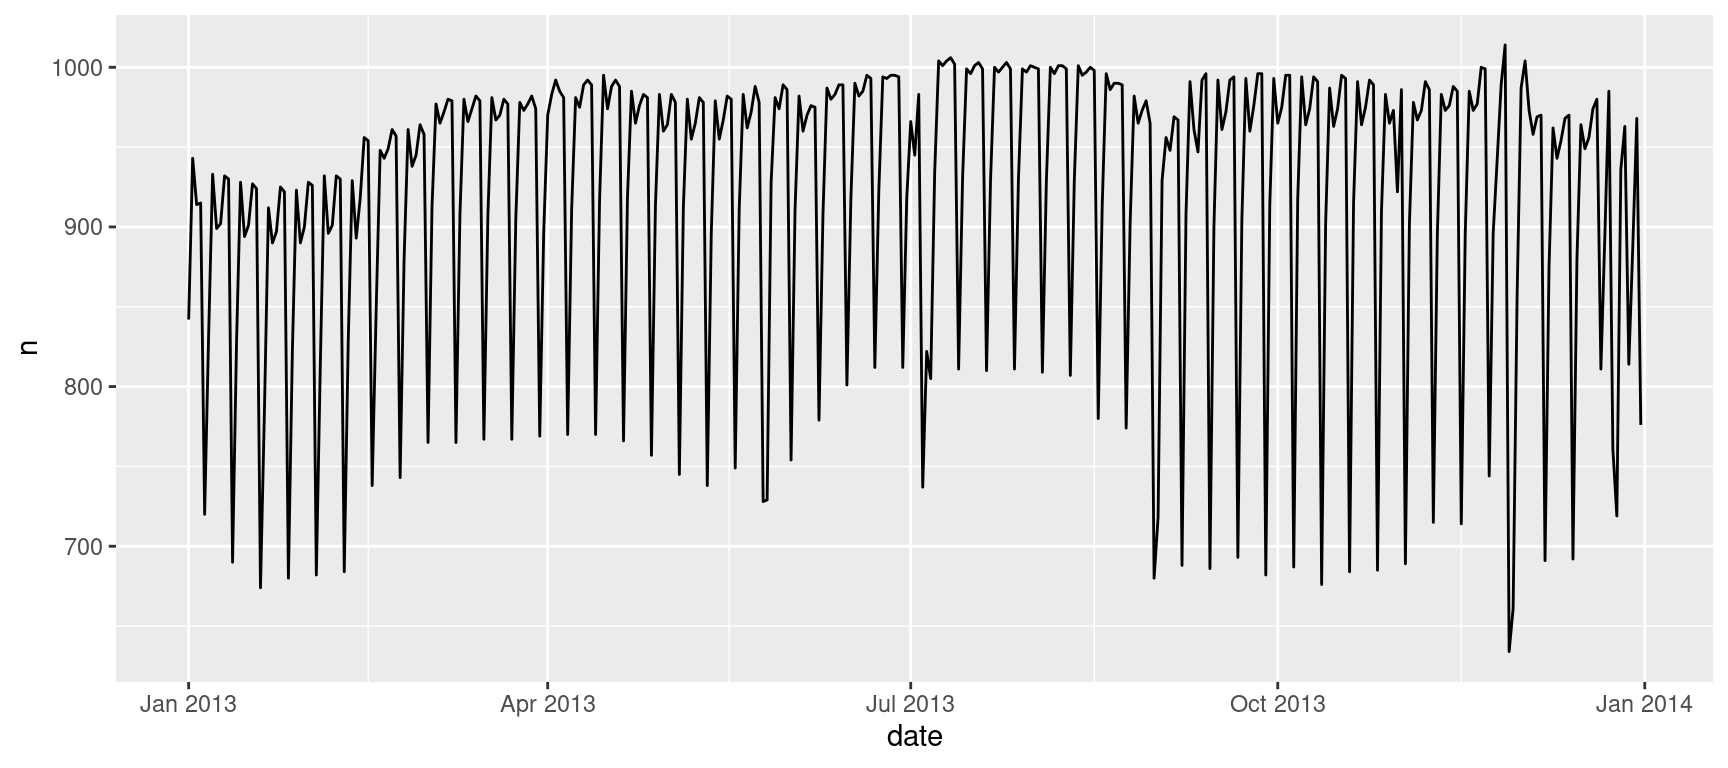
Understanding the long-term trend is challenging because there’s a very strong day-of-week effect that dominates the subtler patterns. Let’s start by looking at the distribution of flight numbers by day-of-week:
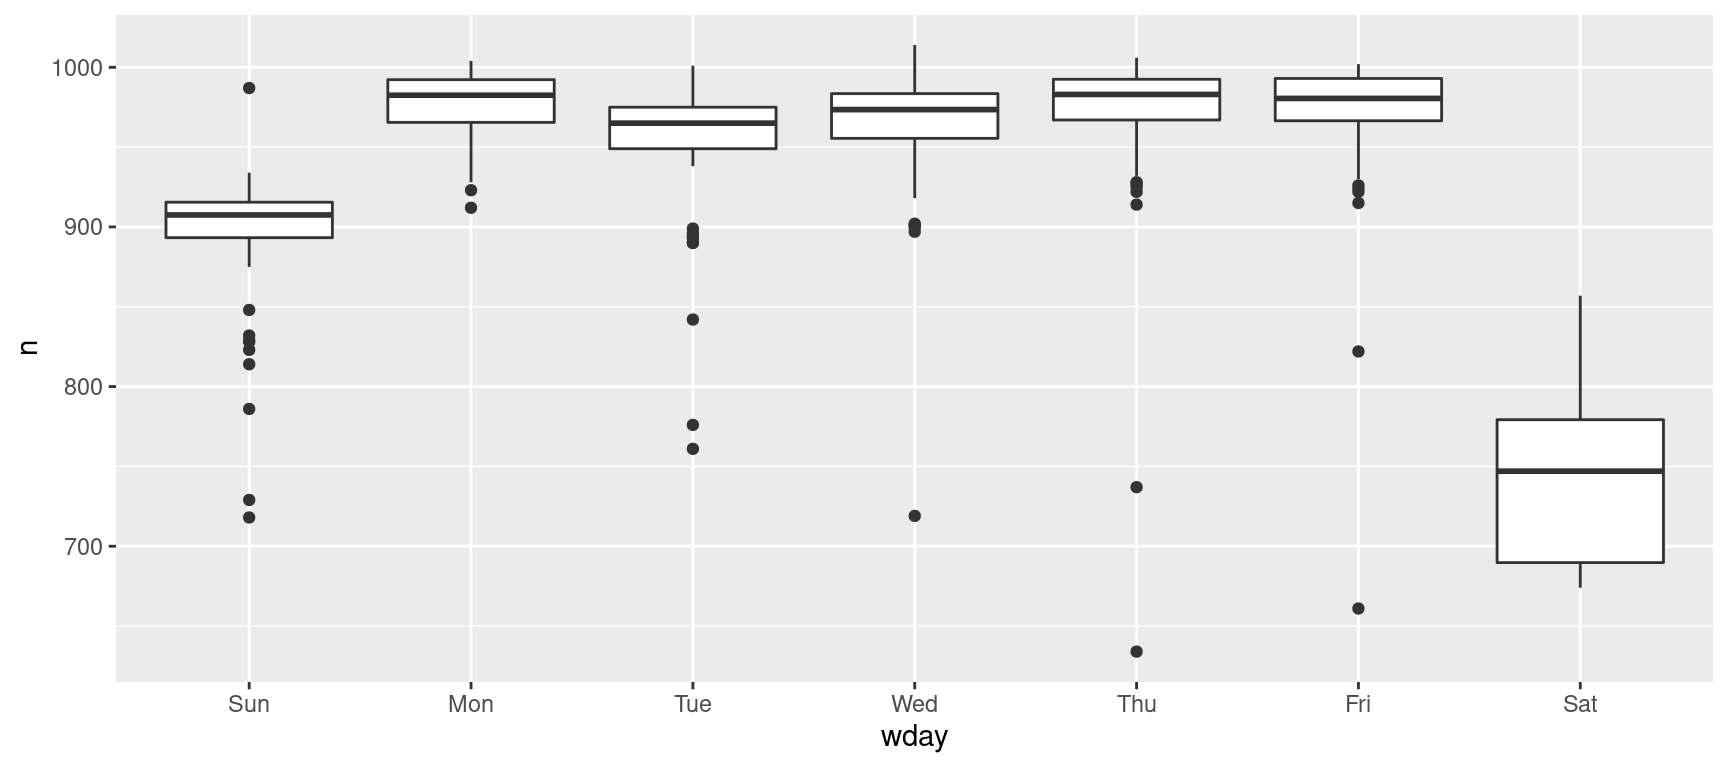
There are fewer flights on weekends because most travel is for business. The effect is particularly pronounced on Saturday: you might sometimes leave on Sunday for a Monday morning meeting, but it’s very rare that you’d leave on Saturday as you’d much rather be at home with your family.
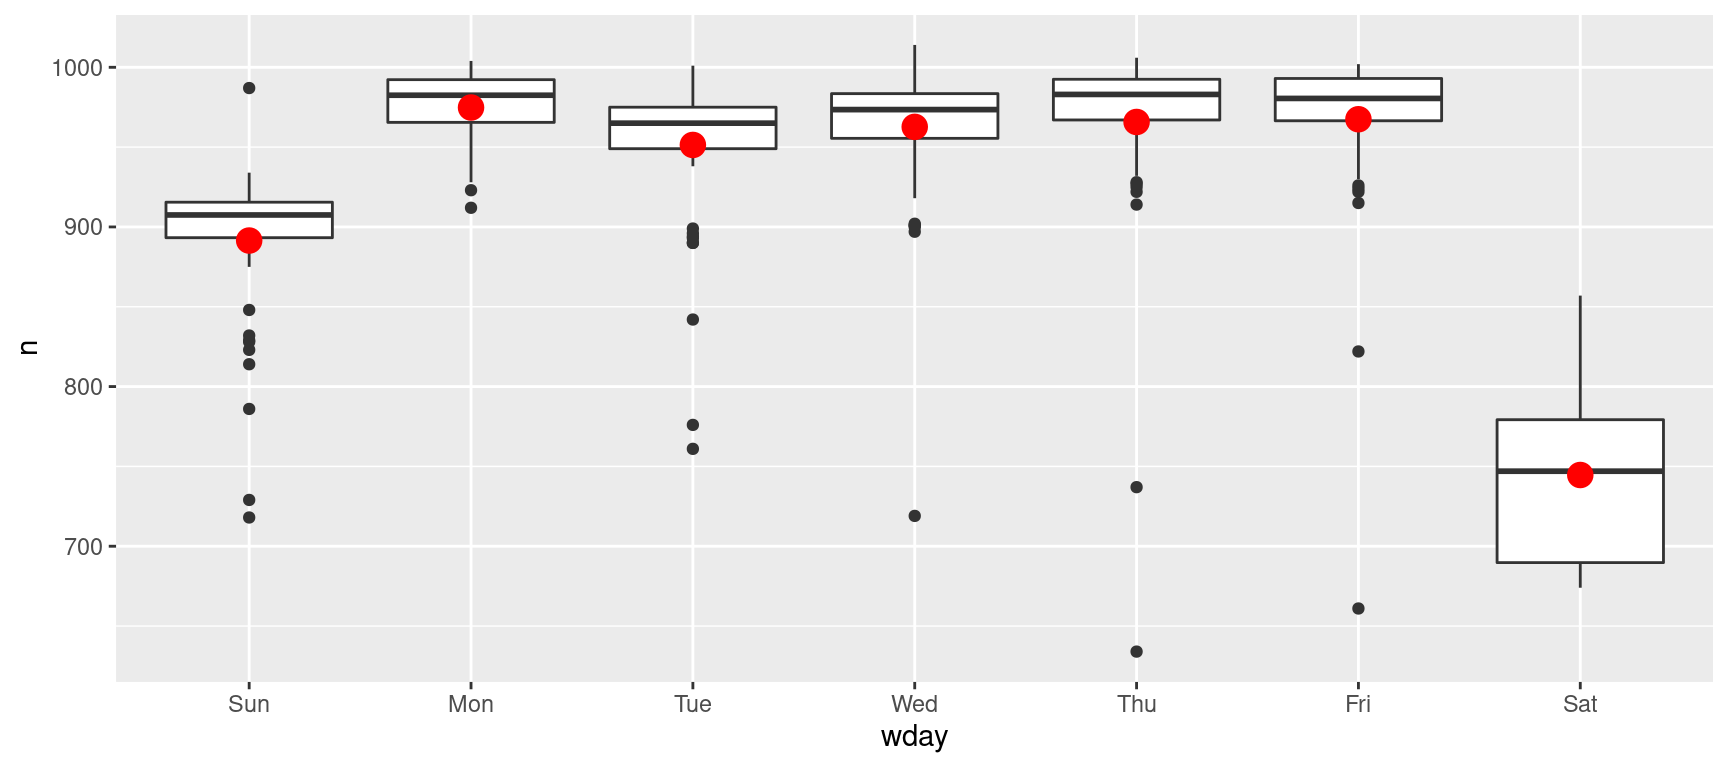
One way to remove this strong pattern is to use a model where a model term is day of the week. First, we fit the model, and display its predictions overlaid on the original data:
Let’s visualize the residuals
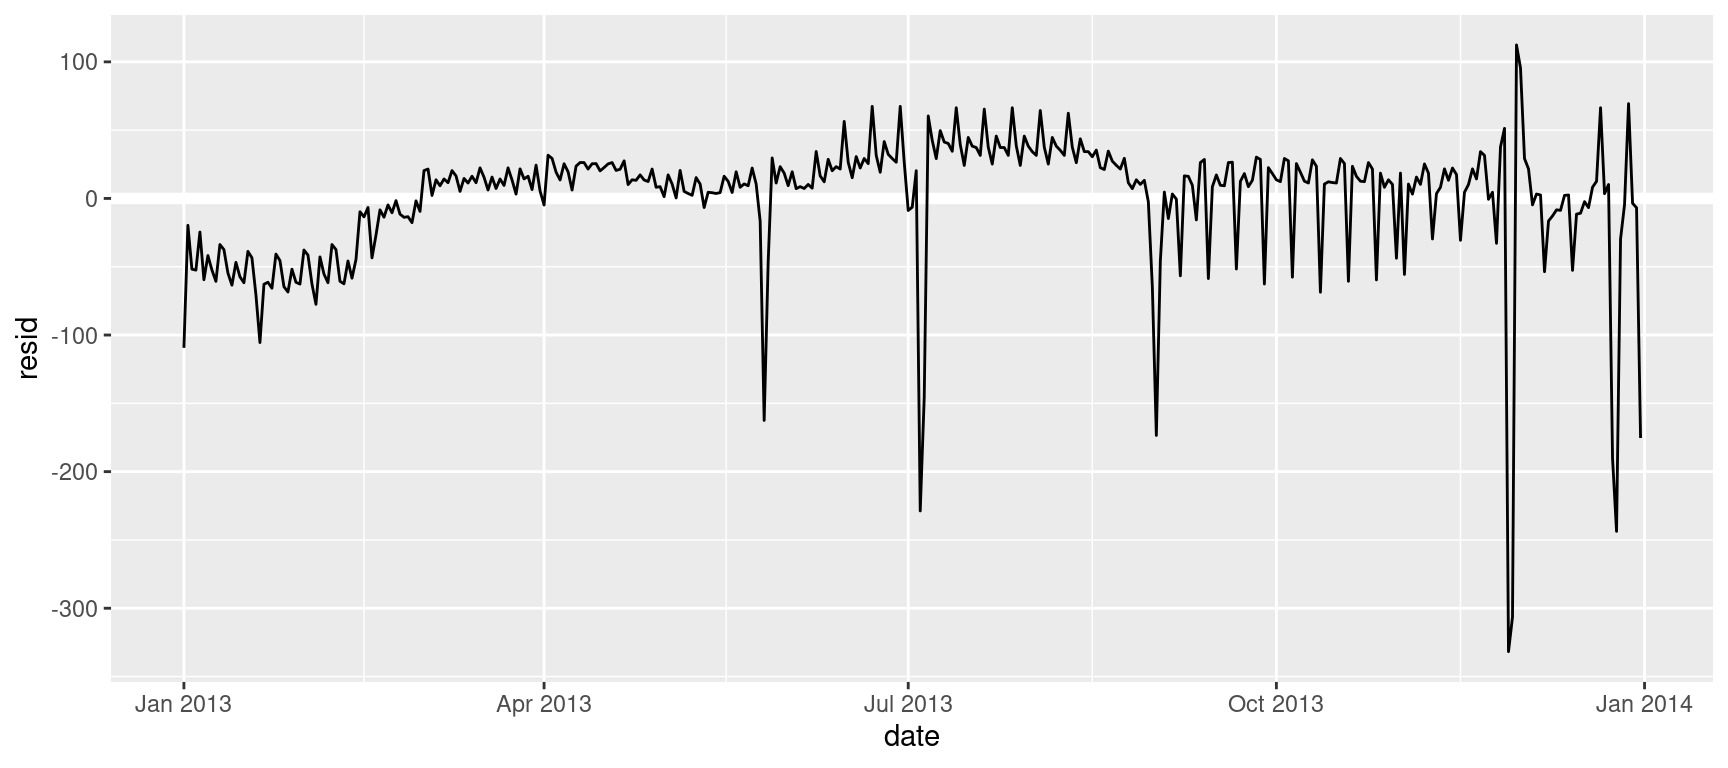
Note the change in the y-axis: now we are seeing the deviation from the expected number of flights, given the day of week. This plot is useful because now that we’ve removed much of the large day-of-week effect, we can see some of the subtler patterns that remain.
- Our model seems to fail starting in June: you can still see a strong regular pattern that our model hasn’t captured. Drawing a plot with one line for each day of the week makes the cause easier to see:
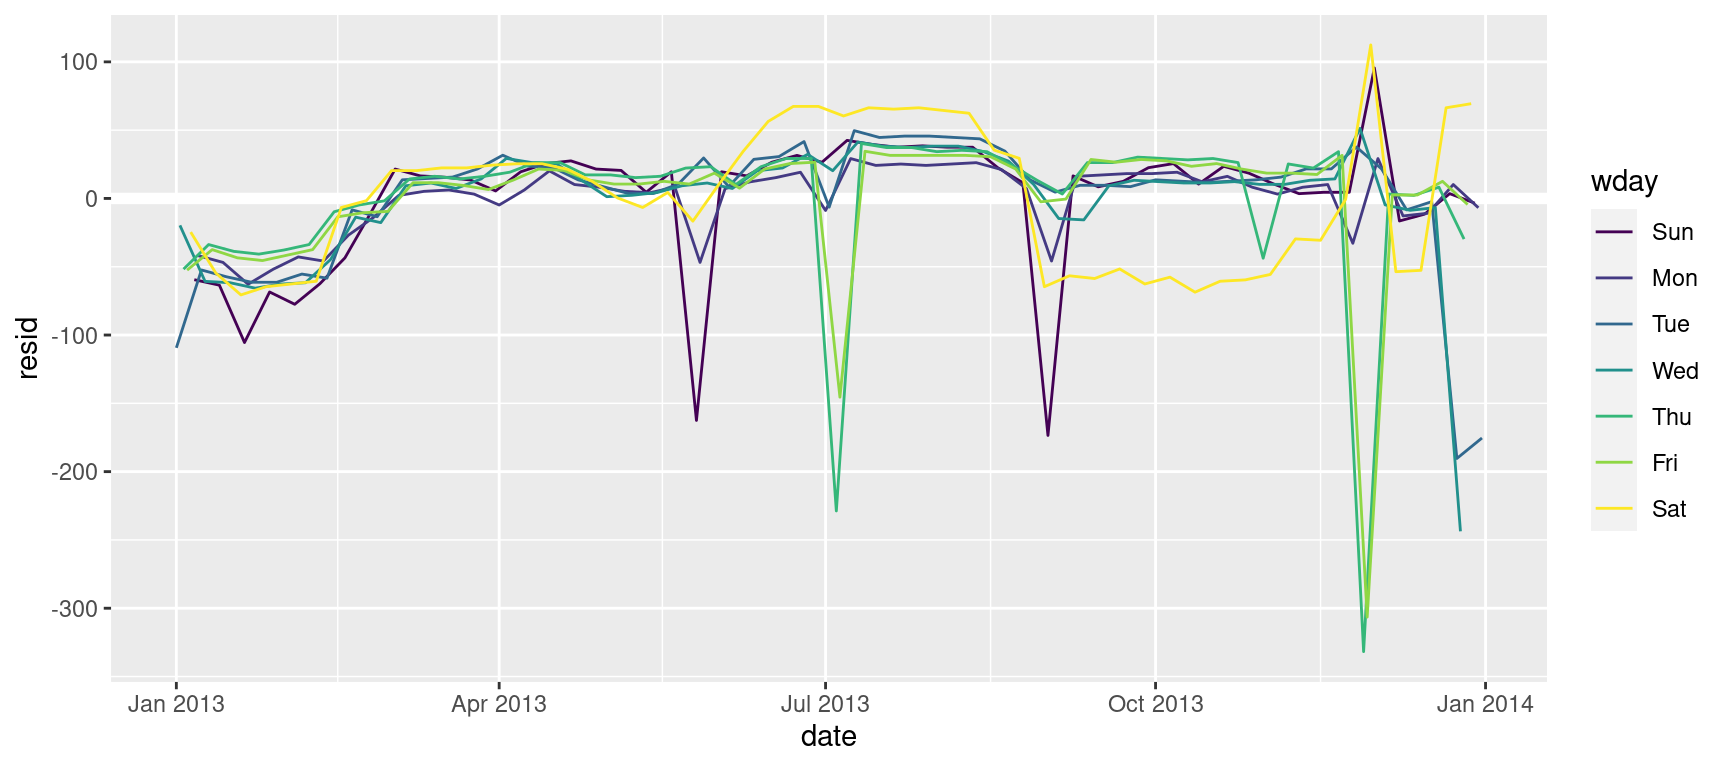
Our model fails to accurately predict the number of flights on Saturday: during summer there are more flights than we expect, and during Fall there are fewer.
- There are some days with far fewer flights than expected. If you’re familiar with American public holidays, you might spot New Year’s day, July 4th, Thanksgiving and Christmas.

- There seems to be some smoother long term trend over the course of a year. There are fewer flights in January (and December), and more in summer (May-Sep).
## `geom_smooth()` using method = 'loess' and formula 'y ~ x'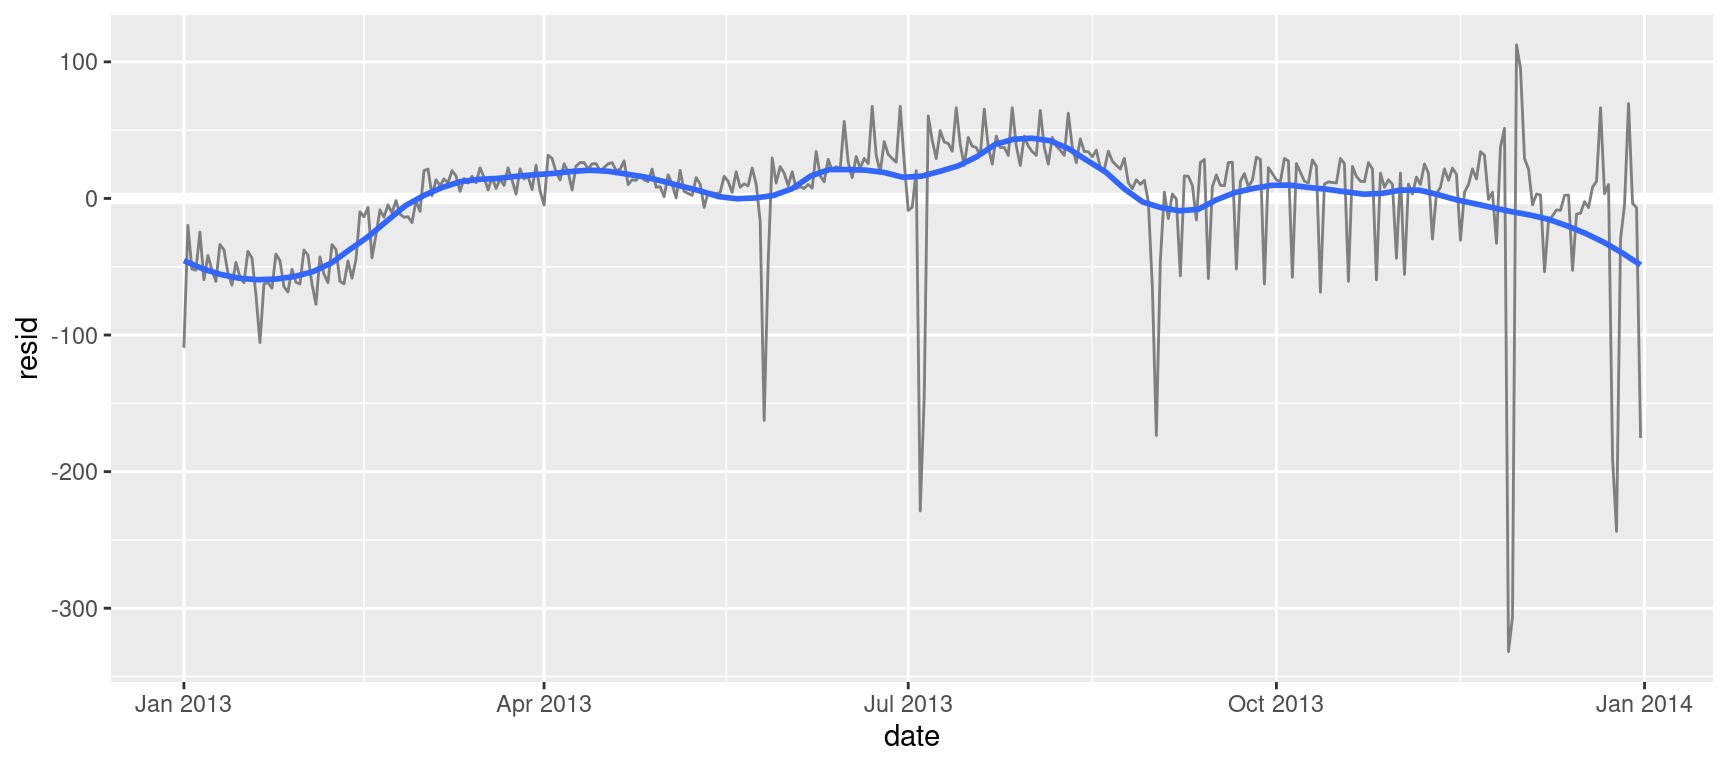
It is not the purpose of this chapter to teach you how to address these, but simply to notice them!!