1.5 Simulating a little health center
Consider now a slightly more complex example where we want to simulate the workings of a little health center. Patients arrive at the health center and are first visited by a nurse. Once they are visited by the nurse they have an actual consultation with a doctor. Once they are finished with the doctor, they meet the administrative staff to schedule a follow-up appointment.
We make the following assumptions:
as before we assume queues to be infinite and that patients do not leave the health center until they are served by the administrative staff;
at all steps patients are visited using a first-come, first-served basis
the health center has one nurse, two doctors and one administrative staff. The two doctors take on average the same time to visit a patient.
The components of the simulation model are the following:
System state:
\(Q_N(t)\): number of patients queuing to see the nurse;
\(Q_D(t)\): number of patients queing to see a doctor;
\(Q_A(t)\): number of patients queuing to see the staff;
\(N_N(t)\): number of nurses available to visit patients;
\(N_D(t)\): number of doctors available to visit patients;
\(N_A(t)\): number of administrative staff available to visit patients.
Resources: patients, nurses, doctors and administrative staff;
Events: arrival of a patient, completion of nurse’s visit, completation of doctor’s visit, completion of administrative staff’s visit.
Activities: time between the arrival of a patient and the next, visit’s times of nurses, doctors and admin staff.
Delay: customers’ waiting time for nurses, doctors and administrative staff
We further assume the following activities:
Nurse visit times follow a Normal distribution with mean 15 and variance 1;
Doctor visit times follow a Normal distribution with mean 20 and variance 1;
Administrative staff visit times follow a Normal distribution with mean 5 and variance 1;
Time between the arrival of patients is modeled as a Normal with mean 10 and variance 4.
The model above can be implemented using the following code (we run the simulation for four hours). Again do not worry about it now!
set.seed(2021)
env <- simmer("HealthCenter")

patient <- trajectory("patients' path") %>%
  seize("nurse", 1) %>%
  timeout(function() rnorm(1, 15)) %>%
  release("nurse", 1) %>%
  seize("doctor", 1) %>%
  timeout(function() rnorm(1, 20)) %>%
  release("doctor", 1) %>%
  seize("administration", 1) %>%
  timeout(function() rnorm(1, 5)) %>%
  release("administration", 1)

env %>%
  add_resource("nurse", 1) %>%
  add_resource("doctor", 2) %>%
  add_resource("administration", 1) %>%
  add_generator("patient", patient, function() rnorm(1, 10, 2))

env %>% run(240)
Let’s look at some summary statistics.
plot(get_mon_resources(env), metric = "utilization")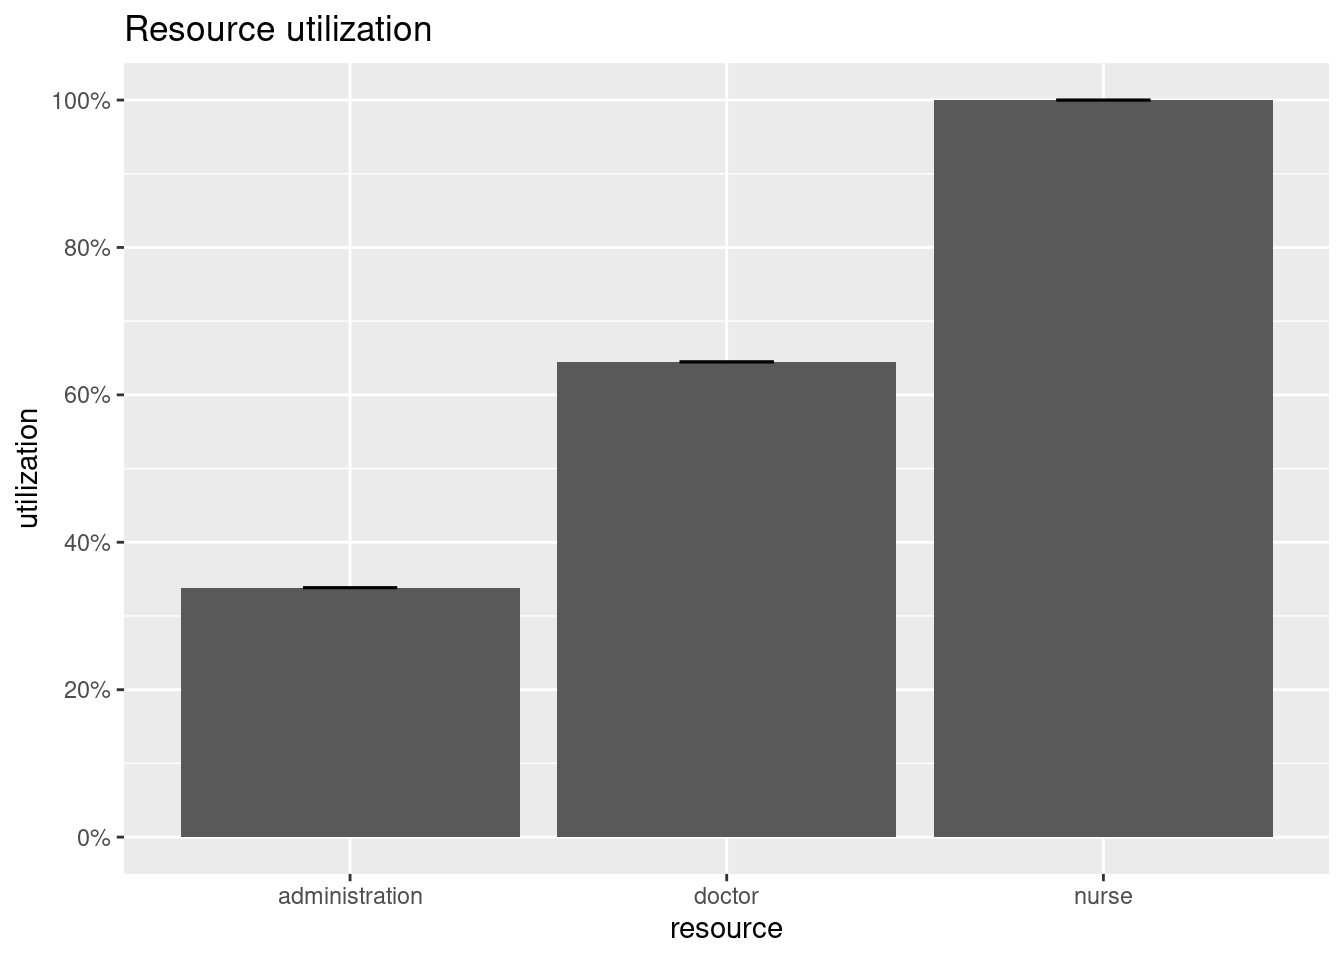
Figure 1.4: Utilization of the resources in the health center
Figure 1.4 shows the utilization of the different resources in the system. Nurses are most busy, doctors are overall fairly available, whilst the administration is more than half of the time available.
plot(get_mon_resources(env), metric = "usage", item = "server")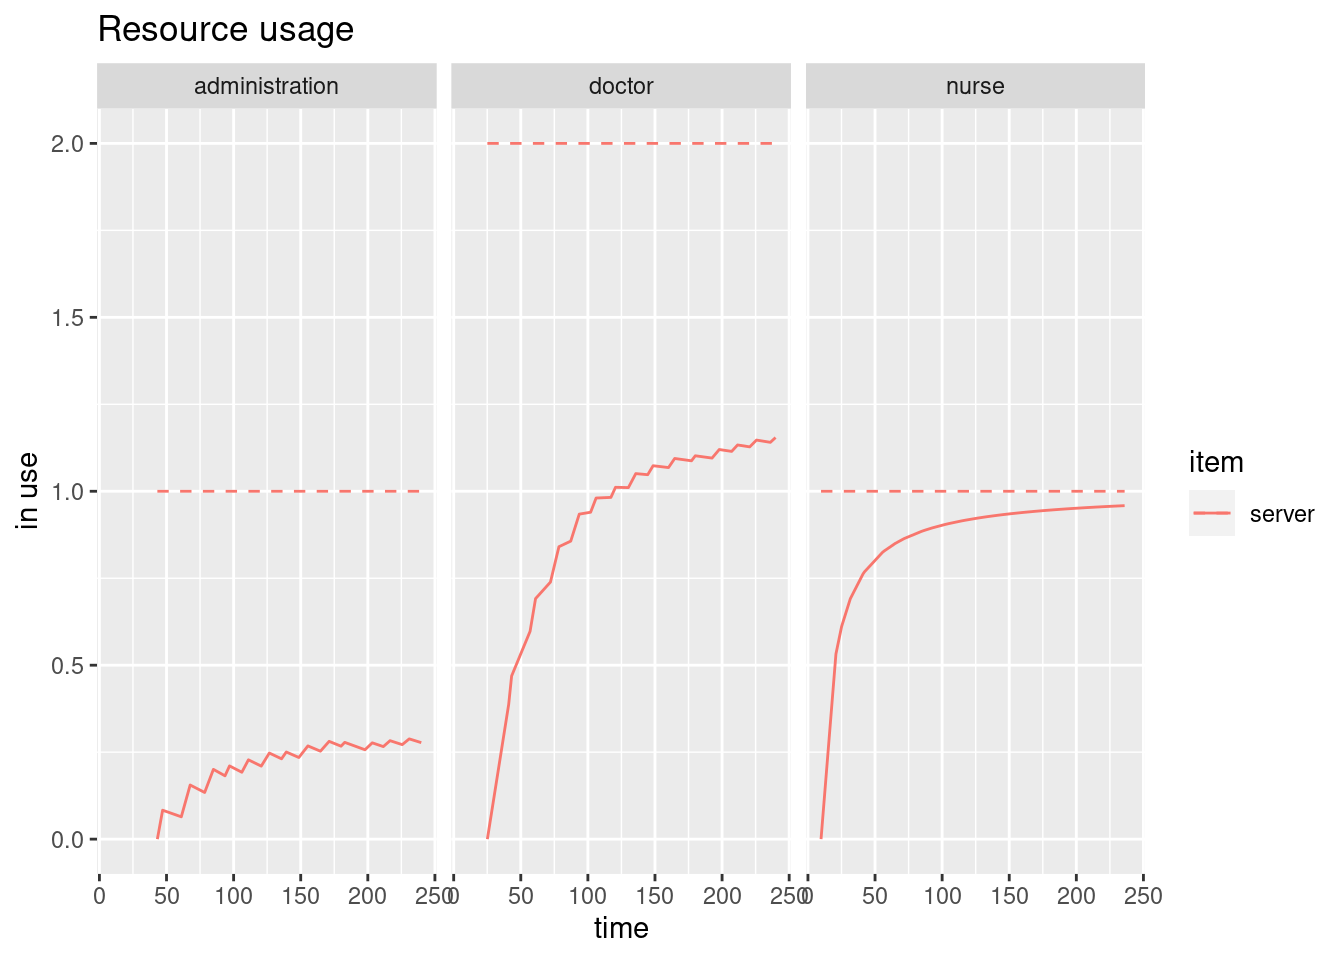
Figure 1.5: Usage of the resources in the health center
Figure 1.5 confirms this. We see that the usage of nurses is almost 1, whilst for doctors and administrative staff we are below the number of doctors and staff available.
plot(get_mon_arrivals(env), metric = "flow_time")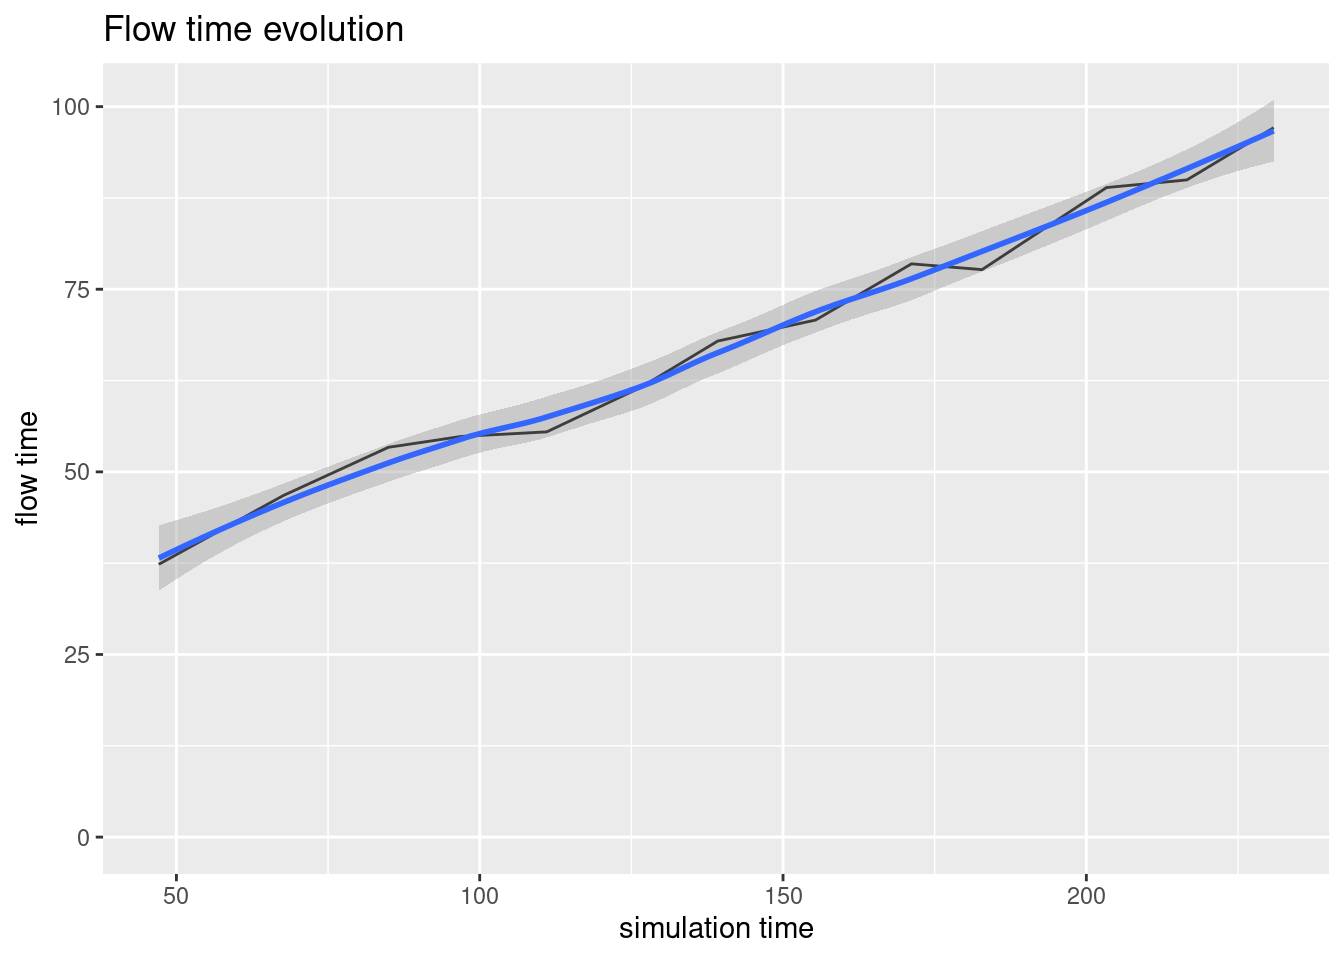
Figure 1.6: Time spent in the health center
Last Figure 1.6 reports the average time spent by patients in the health center. We can see that as the simulation clock increases, patients spend more time in the health center. From the previous plots, we can deduce that in general patients wait for the nurse, who has been busy all the time during the simulation.